
EBITDA Multiples by Industry for Private Companies
Why EBITDA multiples vary more by deal size and market type than by industry alone.
EBITDA multiples get thrown around as if they're a single, stable currency, one number you can look up by industry and apply to whatever business sits in front of you. That's the wrong way to think about it, and it's wrong in three separate ways at once: by transaction market, by size, and by the specific mechanics of the sub-sector. Before any of that, though, it helps to be precise about what the ratio actually measures.
The formula is simple enough: Enterprise Value divided by EBITDA. What it tells a buyer is how many years of current earnings they're paying to own the business outright, debt-free and cash-free. Buyers use EBITDA rather than net income because net income gets muddied by decisions that have nothing to do with how well the business actually runs: how much debt the previous owner carried, what tax strategy the accountant picked, how aggressively the company depreciates its equipment. Stripping those choices out lets you compare one business against another on roughly equal footing.
The number that actually trades is adjusted EBITDA, and the adjustment is where most of the real valuation work happens. A seller who's been paying himself a salary well above what a market-rate manager would cost to do the same job gets that difference added back. One-time legal settlements come out. A revenue spike from a customer who isn't coming back comes out. The truck payment and the family vacation run through the P&L come out too. Unadjusted EBITDA almost always understates what a well-run business is worth, sometimes by a wide margin. Quality of earnings work has become its own cottage industry as a result.
Even a clean adjusted EBITDA multiple doesn't tell you everything. It says nothing about working capital needs, nothing about how much capital spending the business demands just to keep running, nothing about how durable the revenue behind the number actually is. A 7x multiple on a capital-light consulting firm and a 7x multiple on a manufacturer replacing machinery every three years are not the same asset wearing the same price tag. They just look that way on a spreadsheet, and a buyer who trusts the spreadsheet over the mechanics behind it is the buyer who overpays.
Three transaction markets get called "private company multiples." Confusing them is the most common mistake a seller makes
Published "private company multiples" actually come from three distinct transaction markets, each using different metrics on different earnings bases. Treating them as interchangeable is the single most common valuation mistake a seller can make, and it's an easy one to walk into, because all three markets get reported in the press using the same shorthand.
At the bottom sits Main Street, the market for micro-deals typically valued under a modest threshold. BizBuySell reported a median sale price of $350,000 with an average cash-flow multiple of 2.7x in the first quarter of 2026. That 2.7x number gets quoted constantly, and it's almost always misapplied, because it's a Seller's Discretionary Earnings multiple, not an EBITDA multiple. SDE adds back the owner's full compensation on the assumption that a single owner-operator will run the place personally, while EBITDA assumes a market-rate manager instead. Businesses earning under a modest threshold typically get valued on SDE, and the handoff to EBITDA-based pricing happens somewhere in a mid-sized earnings zone above that. Quote a Main Street SDE multiple to the owner of a growing business with several million in EBITDA, and the number will understate what that company is worth, systematically and by a lot.
The lower middle market sits above that, spanning a wide range of EBITDA from the modest to the substantial, and the numbers here come from different sources. IBBA's Market Pulse for the third quarter of 2025 showed lower middle market businesses, with revenue in the tens of millions, selling at a median of 5.3x EBITDA, while smaller Main Street businesses, with cash flow in the low single-digit millions, sold at 3.0x SDE. That gap alone shows how much the metric itself moves the number before size ever enters the picture. DealStats' Value Index puts the all-time median EBITDA multiple across all private transactions at 4.1x, with the most recent quarter at 3.5x, a modest compression relative to the long-run average. Inside the lower middle market itself, size still does most of the work: businesses with EBITDA in the low single-digit millions averaged 6.4x in the first half of 2025, while those clearing well into the double-digit millions averaged 8.1x.
Above that sits the PE-sponsored middle market, spanning enterprise values from the tens of millions to the several hundred millions, where GF Data's contributor network reported an average of 7.3x EBITDA for completed deals. Full-year 2025 landed at 7.2x trailing-twelve-month adjusted EBITDA. That's elevated against the long-run average of 6.7x but well off the 2021-to-2022 spike of 7.6x, when cheap debt and a mountain of dry powder pushed prices to levels that didn't hold. GF Data also flagged improving debt availability and stronger financing conditions heading into 2026, with larger platforms capturing more of that improvement than smaller deals. That pattern, larger deals pulling ahead of smaller ones, recurs throughout this data and matters for every section that follows.
Public company multiples don't belong in a seller's math
Sellers occasionally glance at public market comps and wonder why their advisor isn't using them. The gap between public and private multiples is structural, and it doesn't close in good years or shrink in bad ones.
Aswath Damodaran's January 2026 dataset out of NYU Stern put public market averages at 19.7x across all sectors, against 7.2x for PE-sponsored middle market private deals over the same period, a gap of nearly three times the earnings multiple. That's not a rounding difference. A business in that world trades at a dramatically higher earnings multiple than a private counterpart in the same sector, and no seller should anchor to a number built for a different asset.
Three forces drive that gap, and none of them are going away. A public share trades in seconds on an exchange. Selling a private company takes months of finding a qualified buyer, running due diligence, and negotiating terms, and that illiquidity gets priced directly into the multiple. Public companies also file quarterly audited financials, which lowers a buyer's information risk in a way private financials, however clean, rarely match. And public companies run, on average, dramatically larger than private ones, which pulls in the scale premium covered next.
Formal appraisal practice captures the illiquidity piece directly through the discount for lack of marketability, typically running 15% to 35%, depending on characteristics of the business and the ownership interest being valued. Any seller benchmarking against a public multiple ignores a discount that valuation professionals treat as standard practice.
Size drives more of the multiple than the sector does
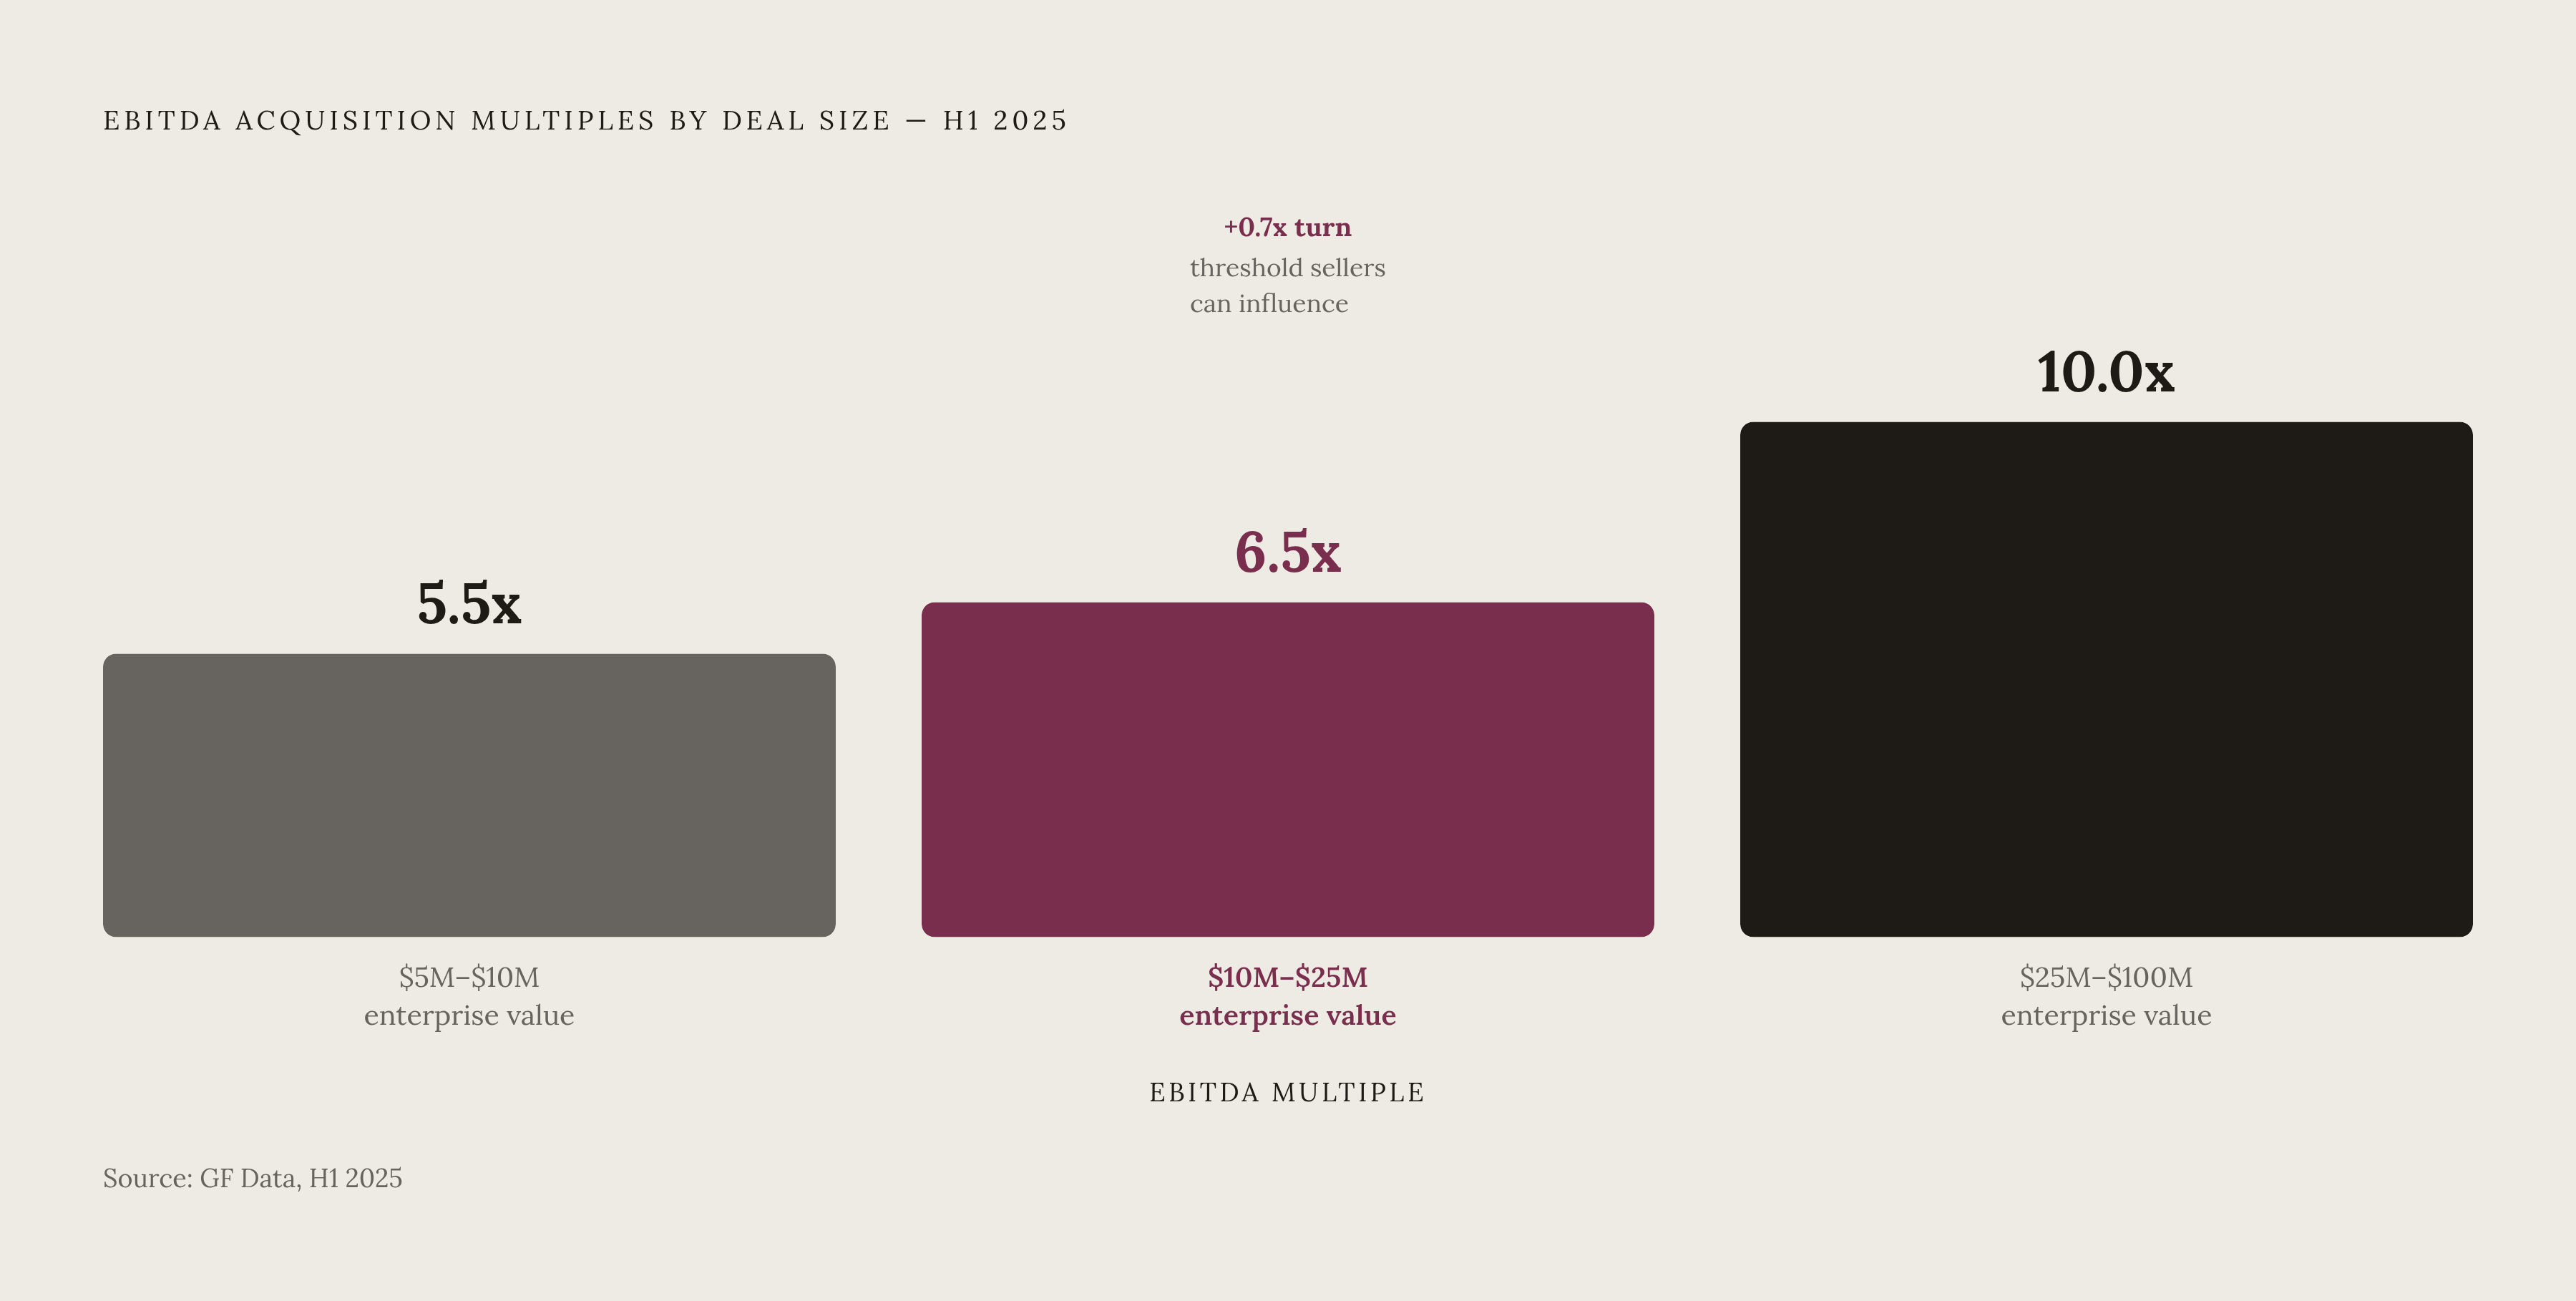
Industry matters. Size usually matters more. A business with EBITDA well into the double-digit millions typically commands 30% to 60% higher multiples than one with EBITDA in the low single-digit millions, in the exact same sector, selling to the exact same type of buyer.
GF Data's first-half 2025 breakdown shows the pattern in granular detail. Deals with total enterprise value in the single-digit millions averaged roughly 5.5x to 5.6x EBITDA. The tier just above that jumped to 6.2x to 6.7x. By the time a deal reaches the bracket with enterprise value in the low hundreds of millions, pricing hits 10.0x. That jump from the lowest tier to the next one up runs close to a full turn of EBITDA, and it appears consistently across reporting periods, not as a one-time blip in a single quarter.
The reasons aren't mysterious. Bigger companies draw more bidders to the table, and more bidders means more competitive tension on price. They also qualify for a wider range of financing structures that smaller businesses often cannot access, which widens the buyer pool further still. Past a certain size, the business usually isn't dependent on one owner walking in every morning, so a buyer underwrites less key-person risk. And inside PE portfolios specifically, platforms command a premium because they sit at the hub of the deal; add-ons bolted onto an existing platform trade at a discount, because their value comes from what they enable inside that platform, not from what they're worth standing alone.
An owner sitting near a size threshold should conclude that growing earnings before going to market usually beats tightening margins or improving the sales mix. Crossing a tier boundary can move the applicable multiple by a full turn or more, and on a business with EBITDA in the mid-single-digit millions, a full turn is real money on the closing statement.
Software and technology: the widest multiple range and the sharpest internal distinctions
No sector spans a wider range of outcomes than software, and the distinctions inside it decide almost everything about where a given deal lands.
Vertical SaaS, B2B SaaS, and mission-critical SaaS businesses trade at 8x to 15x EBITDA in the lower middle market, well above what most services or manufacturing businesses see at similar size. In the PE-sponsored middle market, profitable SaaS businesses command 15x to 25x EBITDA, with private equity firms consistently favoring predictable, recurring cash flow over high-growth, high-burn models that look impressive on a pitch deck but carry more execution risk than most buyers want to underwrite.
A meaningful share of SaaS deals get priced on ARR, an annual recurring revenue multiple, rather than EBITDA, particularly for companies still spending heavily to grow rather than to maximize near-term profit. EBITDA-based comparisons only make sense once a business shows real, demonstrated profitability. Applying an EBITDA multiple to a growth-stage SaaS company still burning cash to acquire customers misreads the deal from the start.
There's a real AI premium in the data too, though buyers have gotten sharper about telling genuine product integration apart from marketing language slapped onto an old feature set. Certain AI-integrated sectors such as data infrastructure and DevOps have seen reported multiples well above broader software averages, reflecting companies where AI actually runs inside how the product functions, not companies that added a chatbot to the login screen. The premium follows the engineering.
Healthcare services: the highest PE deal volume and the most consequential sub-sector split
Healthcare services attract more private equity deal volume than almost any other sector, and the multiples reflect that appetite: a median of 13.53x across 963 closed transactions in fiscal year 2025.
Compression has set in since, though. By the first quarter of 2026, the median TEV/EBITDA across disclosed healthcare M&A deals had come down from 13.0x a year earlier and 14.9x back in the first quarter of 2024. That's a meaningful slide over two years, and it lines up with tighter financing conditions and buyers scrutinizing reimbursement risk more closely than they did during the boom years.
The platform-versus-add-on divide runs sharper here than almost anywhere else. Mid-market platform-scale practices trade around 11x to 12x median EV/EBITDA, while sub-scale add-ons, typically with EBITDA under a modest threshold, get picked up at 5x to 7x, bought specifically to bolt onto a platform that then carries the higher multiple.
Payor mix is the variable that moves the number the most, and it's the clearest example in any sector of a non-financial factor swinging a multiple by several full turns. A behavioral health practice with EBITDA in the low single-digit millions and 70% commercial insurance patients can clear a 12x-plus multiple. The identical practice, same EBITDA, same patient volume, but with 70% Medicaid instead of commercial coverage, prices around 7x. Buyers aren't just underwriting patient count. They're underwriting the insurance contracts standing behind those patients, because reimbursement stability gets priced directly into the deal.
Manufacturing: reshoring tailwinds meet deal-count headwinds, with a sharp divide between commodity and engineered products
Most manufacturers in the lower middle market trade between 5x and 9x adjusted EBITDA. GF Data put the full-year 2025 average for PE-sponsored deals across the broader private market at 7.2x, and the same size gradient that runs across that broader market appears inside manufacturing as well.
There's a genuine tailwind running through the larger end of this market. Manufacturing multiples climbed from 10.2x to 11.1x between the first half of 2024 and the first half of 2025, pushed by reshoring, supply chain diversification away from single-country sourcing, and defense spending. That climb, though, reflects larger and often upper-middle-market transactions, and it hasn't reached every deal size evenly. Tariffs and volatile input costs have created real headwinds for smaller manufacturing transactions, proof that a sector-level tailwind can sit right next to pressure at the smaller end of the same market.
What separates a 5x manufacturer from a 12x one comes down to one question: does the business make a commodity, or does it make a specification? Asset-heavy commodity producers, exposed to input cost swings, thin pricing power, and customers who can switch suppliers without much cost, trade at 5x to 7x. Engineered-product specialists holding real intellectual property and genuine customer lock-in trade at 9x to 12x, because buyers pay for defensibility there, not just for the capacity to produce units. Any manufacturer sorts into one of those two buckets before anything else about the business gets decided, and knowing which bucket comes first.
Financial services: insurance brokerage and RIA/wealth management as recurring-revenue roll-up stories
Insurance brokerage and RIA/wealth management run on the same underlying thesis. Recurring revenue, renewal commissions on one side, AUM-based fees on the other, paired with a fragmented base of small independent operators, makes both sectors ideal territory for private equity roll-ups.
Insurance brokerage shows the pattern clearly. Agencies with adjusted EBITDA above a modest threshold averaged 11.8x in the first half of 2025, essentially flat against the 11.9x average for all of 2024, which suggests the multiple has settled rather than kept climbing. The mid-market band, spanning EBITDA from the low to the low double-digit millions, bracketed 11.4x to 11.8x across the period, a tight range that points to a mature, well-understood asset class rather than one still being re-priced by buyers guessing at fair value.
The roll-up logic explains why. Platforms pay up for scale, then use that scale to buy smaller independent brokers at a discount to the platform's own trading multiple, pocketing the spread as pure arbitrage. It's the same mechanic driving healthcare's platform-versus-add-on gap, applied here to a business built on renewal commissions instead of patient contracts. That mechanic is a large part of why insurance brokerage has stayed one of the more reliable consolidation stories in private equity for years running, and sellers who don't understand it tend to walk away from the table having left a full turn or two of EBITDA on it.

